Looker Studio, formerly known as Google Data Studio, is an intuitive tool for visualising data from various Google tools. The creators from Mountain View, California, see it as a power source that collects “energy” from multiple sources such as Google Analytics, Search Console, and Google Sheets, and transforms it into accessible and readable reports.
The tools and services within the Google Cloud platform allow users to collect vast amounts of data. However, the goal is not just to possess the data but to interpret it and identify trends. Looker Studio helps present data in a digestible format, enabling users to find answers rather than being overwhelmed by a constant stream of numbers. Google Data Studio used to be the basic Business Intelligence (BI) solution provided by the Google Cloud platform, while Looker served as a tool for those seeking more advanced capabilities. Hence, the idea for a single tool emerged.
A revamped Google Data Studio
To understand why Looker Studio came about, we need to go back to 2019 when Google acquired a tool called Looker. As noted by Forbes columnist Peter Cohan, the appetite for software related to business analytics was substantial at that time, with an average growth rate approaching 11%.
However, Looker was growing even faster than the market, at a rate of 70% annually, and its founder, a former punk rock musician, may not have wanted to manage such a large company. For Google, acquiring Looker was a strategic move, especially considering its ties to further advancements in artificial intelligence (AI) and machine learning (ML).
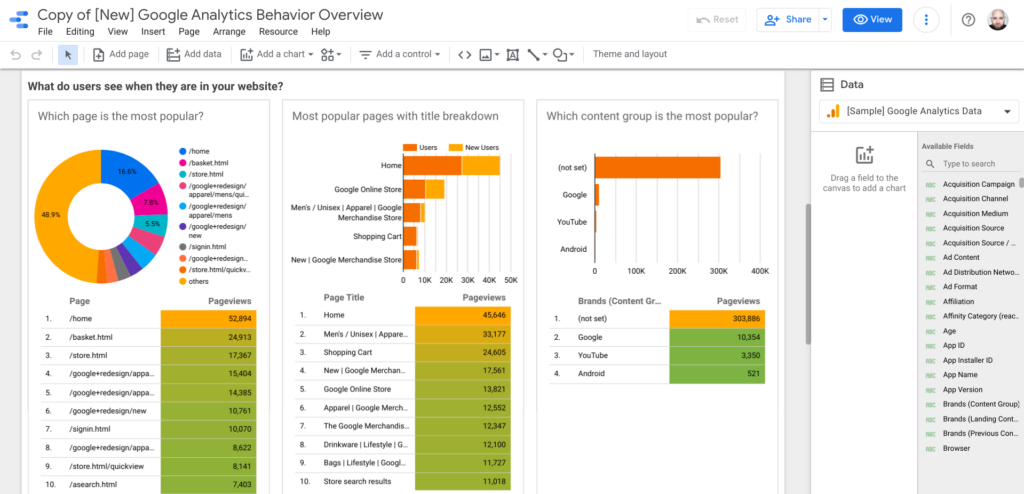
For two years, Google Data Studio and Looker coexisted. Here is what the former looked like:

However, since October 2022, all of Google Cloud’s Business Intelligence products operate under a single name. What benefits does this solution bring to users?
Why is it worth using Looker Studio for creating reports?
One of its key advantages is the user-friendly interface. It is designed in an intuitive way, with the ability to drag and drop objects or create custom dashboards. This greatly facilitates the rapid creation of reports.
Another functionality is the library of report templates, which makes data visualization easier. It allows for easier customization of the report’s view according to real needs. Data sources act as data pipes, connecting Looker Studio reports with the source data. Each source has a unique pre-built data connector, providing easy access to the data.
Integration has also been carefully considered, thanks to the Looker Studio API interface. For users utilizing Google Workspace or Cloud Identity, automatic management and migration of Looker Studio resources have become possible.
Some reports are just begging to be shared with the world. The tool allows embedding reports on websites and intranets, making it easier to display real-time reports.
Looker Studio add-ons worth implementing
While the reports available within the tool already allow for advanced customisation, they can be further enhanced by using a range of add-ons available in the Looker Marketplace. Among the notable ones are the Calendar Heatmap, which highlights anomalies and trends over time, Gauge, a progress meter for plan execution (e.g., KPI), and the Cartoon add-on, a fun variation of standard reports that allows switching between line, pie, and bar charts, presenting data in a visually unconventional way.
Pricing: How much does it cost to use this service?
Looker Studio is available in a free version, but for companies seeking a tool for data analysis on a large scale and workspace sharing among team members, Looker Studio Pro can be an interesting option. In addition to better collaboration capabilities, access to technical support is undoubtedly an additional benefit.
If you want to learn more about the possibilities offered by Looker Studio Pro and the current pricing conditions, contact FOTC experts. We will help you choose the right solution.
