Infrastructure is at the heart of many modern businesses – especially those that develop and offer digital products. The concept of “infrastructure” includes many elements: servers, virtual machines, disks, databases, networks, cloud computing services, and more. They need a monitoring tool that helps in capacity planning and prevents performance issues. This is where Cloud Monitoring – a Google Cloud service – comes in. It allows you to monitor every element of the infrastructure, even in the multi- or hybrid cloud model.
In order to ensure the availability and stability of products and, at the same time, keep up maintain a high pace of development, organizations must monitor every area of the infrastructure. They need to be able to quickly respond to failures, and, ideally, identify potential incidents and threats before they occur.
What is Google Cloud Monitoring?
Cloud Monitoring is a Google cloud service that measures Google Cloud services, as well as multi-cloud infrastructure (e.g. in combination with GCP + AWS) or hybrid cloud. It collects information about the condition of services and applications, availability and performance and presents it using lists, a monitoring dashboard or self-created charts. It allows you to get answers to questions such as:
- Are the running services and applications available and running smoothly?
- What is the load on a given service?
- What is the uptime of a given service?
- Is the website functional and responding properly or are the any performance issues?
- What is the performance of services, applications and sites?
Setting alerts
In addition to presenting the results in graphs, the Cloud Monitoring tool helps in capacity planning and allows you to set alerts. The notification system (in addition to text messages and emails) can be integrated with external tools such as Slack or PagerDuty. Each notification can be combined with the necessary documentation and instructions on how to deal with a specific incident.
Read also: Business Continuity Plan – what is it and how to create it?
SRE – what is Site Reliability Engineering?
Site Reliability Engineering (SRE) is a concept that supports the creation of scalable and highly reliable applications or programs. It allows you to strike balance between high development speed and the stability of subsequent system elements. SRE activities are intended to minimize errors and failures, including through continuous monitoring (and improving methods of tracking and combating incidents) and automation of tasks performed.

How to implement a secure Google Cloud environment?
What can you monitor with Google Cloud Monitoring?
If you create a project in Google Cloud Platform, you will automatically be able to run the Cloud Monitoring service in it. If you want to grant access to another person, make sure that the assigned role includes permissions to edit Cloud Monitoring.
Cloud Monitoring allows you to view and manage metrics for your projects in the following ways:
- for a single Google Cloud project,
- for multiple projects within the organization,
- for multiple Google Cloud projects within multiple organizations,
- for at least one Google Cloud project and any number of AWS accounts,
- for at least one GCP project and on-premise infrastructure.
Let us help you launch and explain how Cloud Monitoring works
Launch of the Cloud Monitoring service
To access the service, you must be logged in to the Google Cloud Platform console and select the project for which monitoring is to be created.
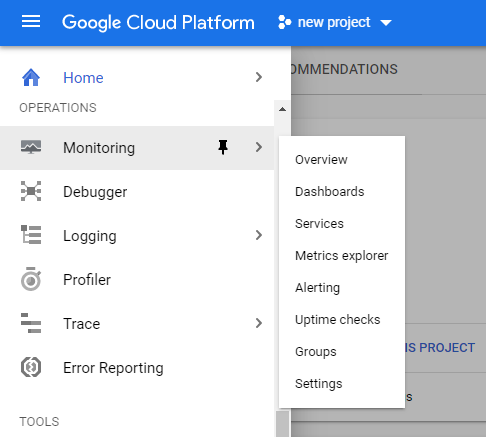
To start the service, select Monitoring from the menu on the left.
A panel with a project summary will be automatically created.

The panel contains a complete set of information – dashboards, notifications and availability checks, allowing you to assess the condition of the infrastructure used in the project and its most important elements:
- a list of monitored resources in the table on the left (Resources dashboard),
- a list of created accessibility control rules and their results divided into locations (Uptime checks),
- a list of grouped resources, with warnings regarding individual sets at the bottom (Groups),
- a dashboard in which current and closed incidents to the right (Incidents). It contains events that went beyond the established norms and triggered an alert.
- charts with information about the monitored services in the project (Charts).
Log tracing
In the panel you can also go to the Logging or Trace log viewing service – a service for tracking delays and locating bottlenecks.
If you want to track more than one project, you should create one multi-project metrics scope – range of metrics covering several projects. Here you can find information on how to create a scope like that: Viewing metrics for multiple projects.
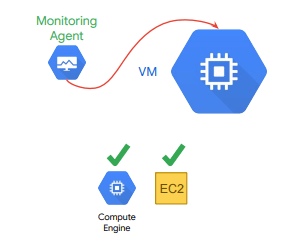
Monitoring agent
Cloud Monitoring can access some metrics of used virtual machines (CPU, disk traffic, network traffic, availability information) without “intermediating” the agent. However, to gain access to additional system resources and application services, you must install the Monitoring Agent.
Uptime checks – availability control rules
Accessibility checks (uptime checks) are requests sent to resources to check whether they respond – that is, whether they function properly.
Using uptime check you can verify the availability of public services in locations around the world. Cloud Monitoring gives you the option to check the status of your App Engine application, host URL, Compute Engine instance, AWS instance, or Elastic Load Balancer (Amazon’s cloud load balancing system). In the uptime check configuration, you must indicate the network protocol – HTTP, HTTPS or TCP. You can create an alert policy for each rule and view information about the time between sending the request and receiving the response from each location.
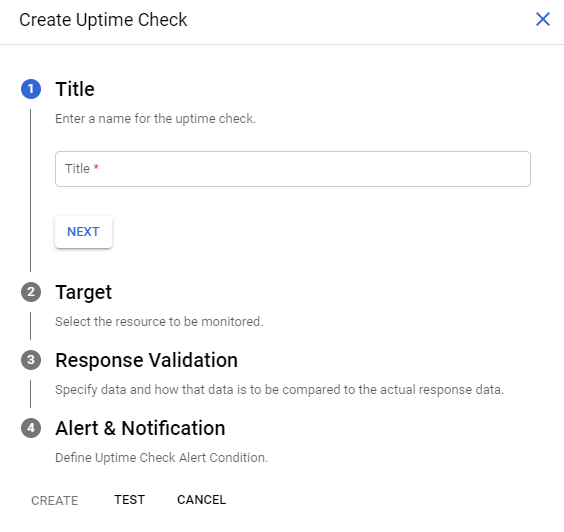
To create an availability check, select Monitoring in the menu, then Uptime check and press Create uptime check (at the top of the screen).
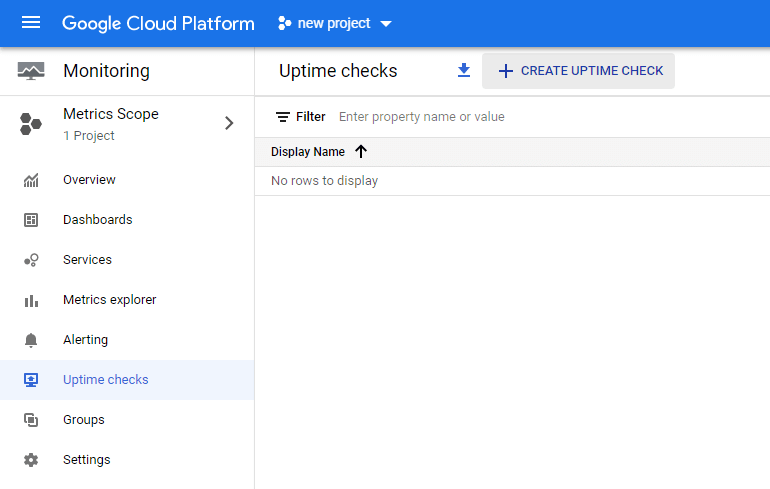
A window will appear in which we will create an accessibility control rule that meets the indicated conditions.
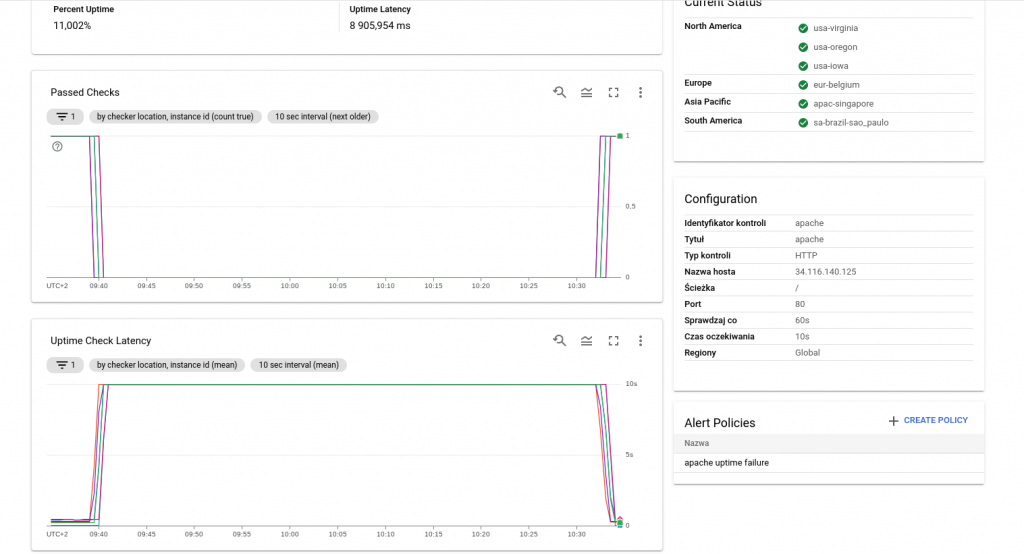
Sample uptime check
The example below checks HTTP availability. The resource is checked every minute with a 10-second timeout. Uptime checks that do not respond within this limit are considered a failure.
Below are examples of what the status visible in the main Uptime checks panel and in the detailed panels may look like.
1. Virtual Machine Failure:
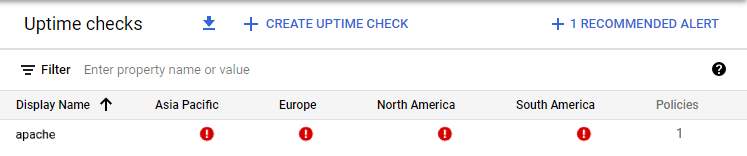
Uptime check view:

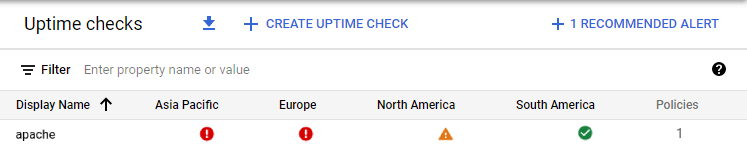
2. Partially functioning virtual machine:
3. A properly functioning virtual machine:
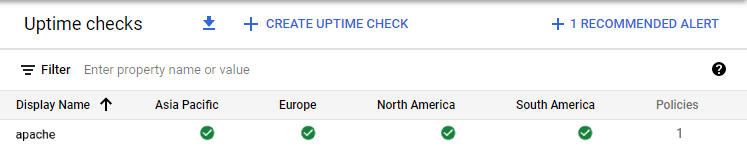
Uptime check view:
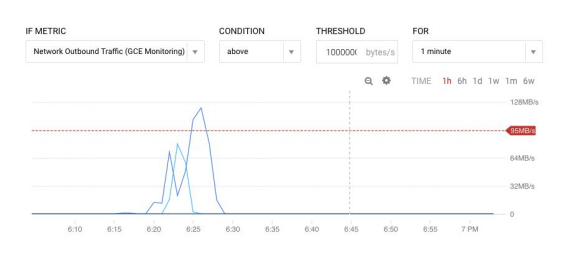
Alerts
Charts are extremely useful, but few people have time to observe changes taking place 24/7. If you want to be informed on an ongoing basis about anomalies (e.g. server failure, reaching a specific level of capacity or throughput, or approaching the billing threshold), you should create alert policies that will send notifications when specific conditions are met. You can receive the notification via a selected channel – e.g. SMS, e-mail, Slack or PagerDuty.
Create an alert
Here’s an example of what creating notification rules looks like. To create an alert, select Monitoring > Alerting from the menu on the right, and then click Create Policy.

The policy configuration window will appear.
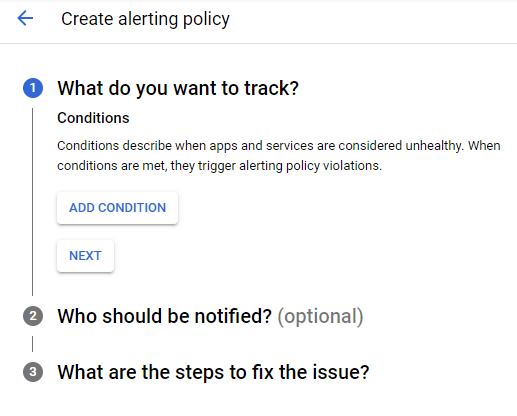
Create a condition by clicking Add condition.

Create a metric. In this case, it will be the metric for the virtual machine.
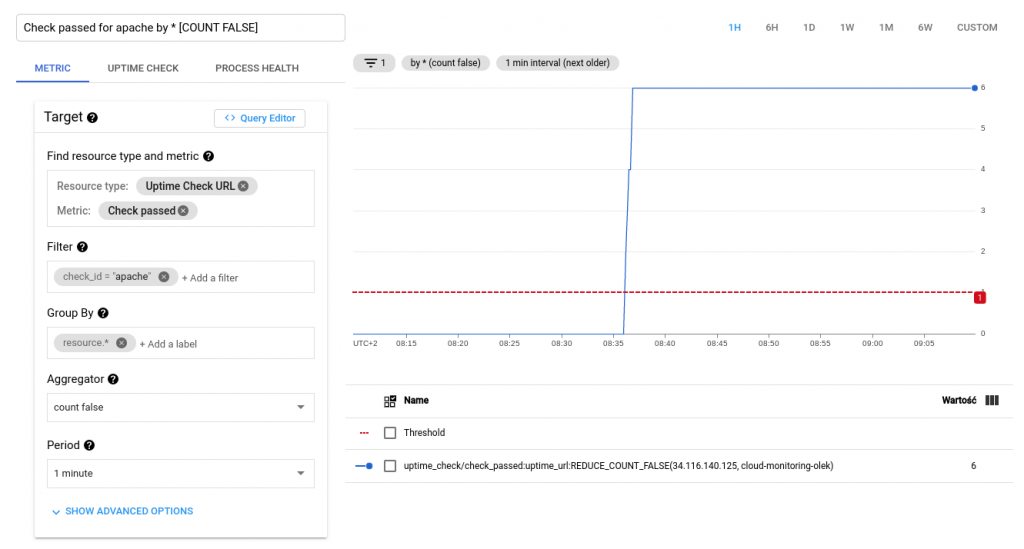
Select Uptime Check URL.
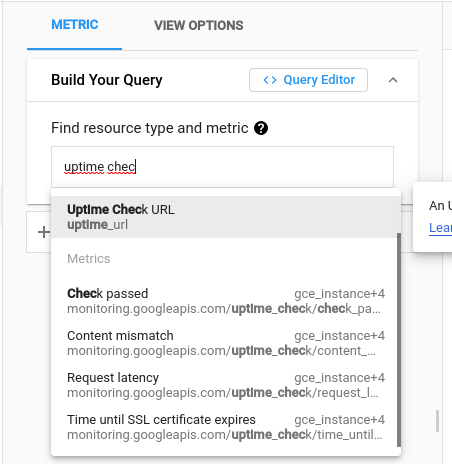
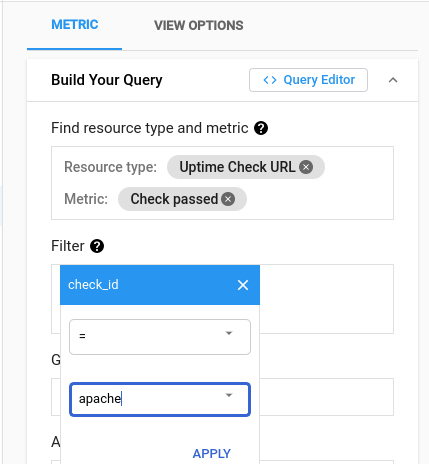
To check whether the instance is working, select Check passed.

As a filter, add the created accessibility control – Apache.
Refer to your projects.
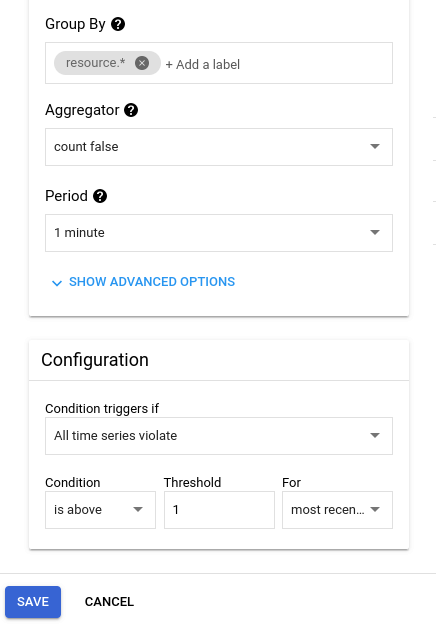
For the above alert to take effect, the virtual machine must be turned off for at least one minute.
Notifications
To be informed when a problem occurs, configure notification channels appropriately. Click Manage notification channels.

Next select and configure the channels through which notifications are to be sent. To use a specific channel, click Add new.

A window will appear in which you can configure the selected channel, e.g. via email\:
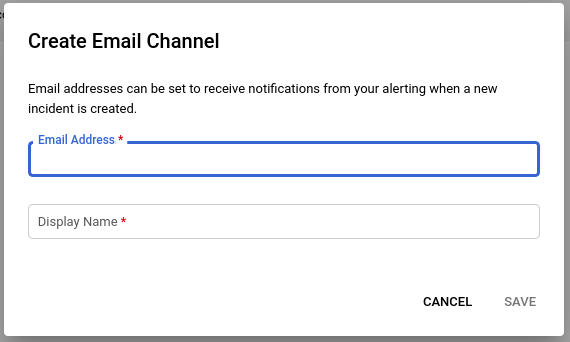
Once configured, the channels will appear in the list.

We can also add appropriate documentation to the alert to make it clear what to do in the event of a specific failure.

Below is an example email notification:
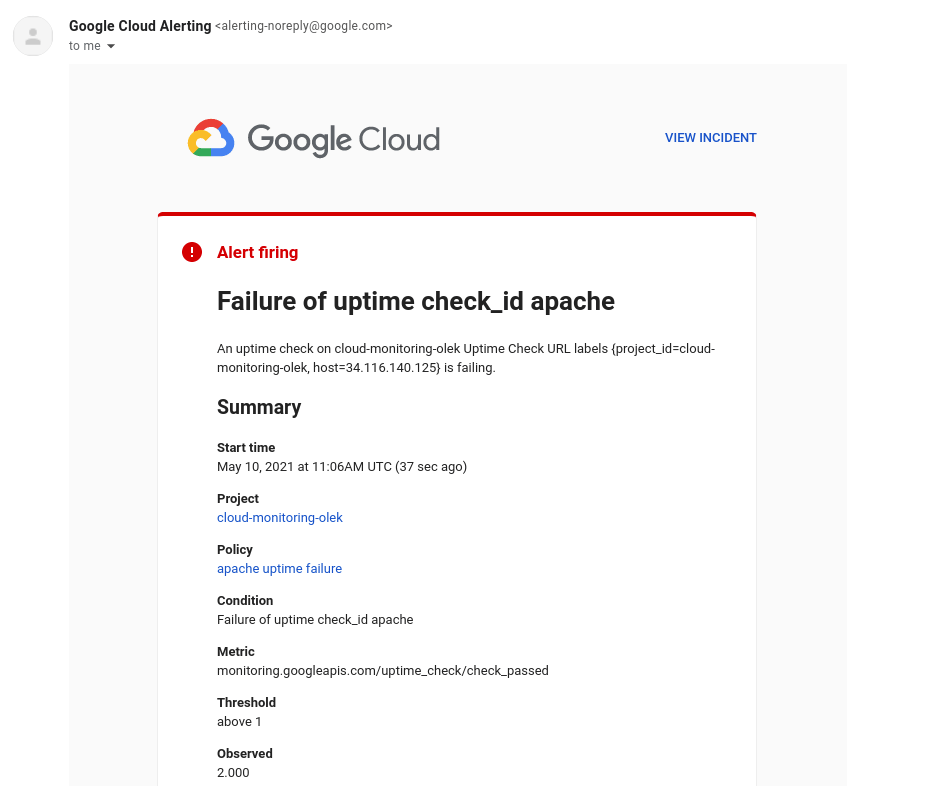
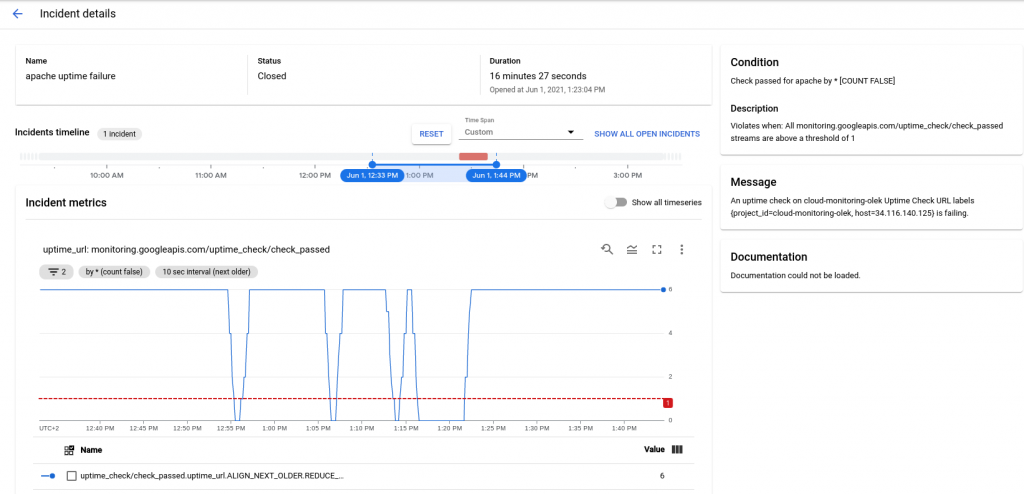
From such an email, you can go directly to the Google Cloud console by clicking View incident. A window will open with details of the failure:
You can also create alerts and select channels using the API. For more information, see the Google Cloud documentation:
Tips for creating alerts
- It’s a good idea to supplement the alert with instructions, information about which resources should be verified and links to necessary documentation. This will allow the incident to be resolved more quickly, even by a person who is dealing with it for the first time.
- It’s recommended to monitor the symptoms, not the causes. For example, you can set an alert for failed database queries and, in the event of an incident, check whether the database is down.
- You should make sure that you use several notification channels at the same time, for example e-mail and SMS. This will avoid a situation where one of the channels fails.
- It is also important to avoid sending too many notifications. Too many alerts can cause people who receive them to ignore them. Monitoring alerts are intended to be useful and tailored accordingly. Configuring alerts at a very detailed level in unimportant areas is not a good practice.
Dashboards and graphs
In Cloud Monitoring, we can create our own dashboards for the values we want to monitor – both metrics collected by default by the service, via the monitoring agent, log data or custom metrics. Charts can show numerical data or ranges; it is not possible to present text data.
Graphs
Graphs provide insight into the health of virtual machines and network traffic between instances. For example, you can create charts that will present information about the level of CPU use of a given instance, packets or bytes sent and received by this instance, or dropped by the firewall. By using filters, you will get a view of the data at a more detailed level.
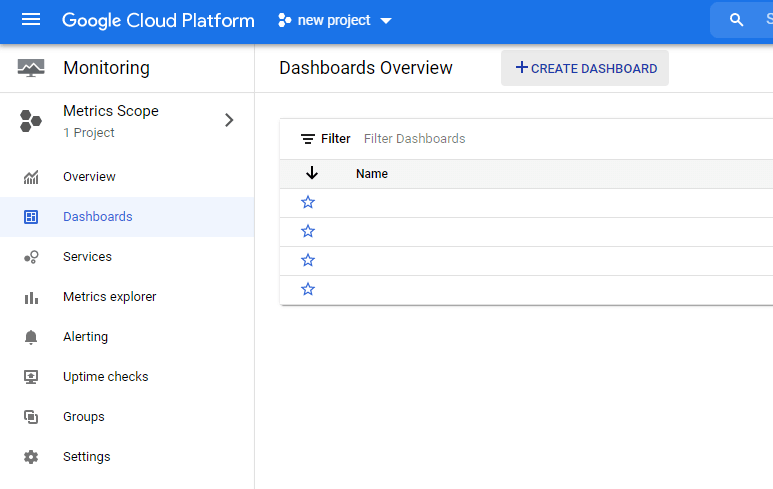
To create a dashboard, select Monitoring > Dashboards from the menu on the left. After going to the panel, click Create Dashboard.
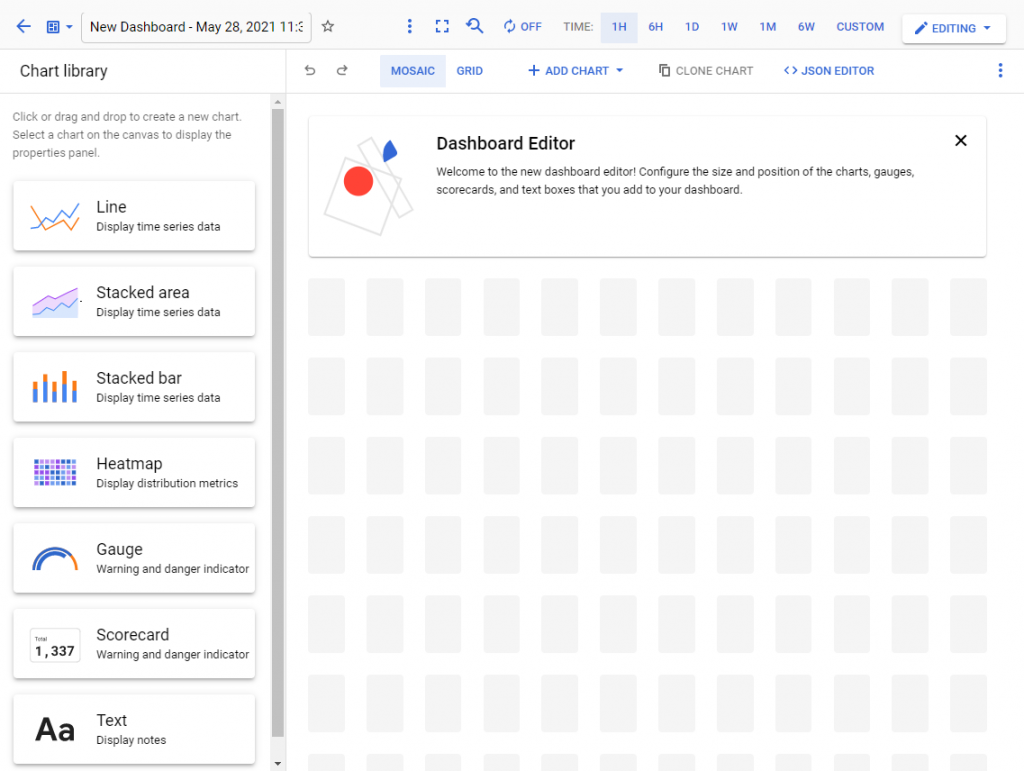
Name the panel and modify it accordingly. You can choose from various types of charts and data presentation models (visible on the left side of the screenshot below).
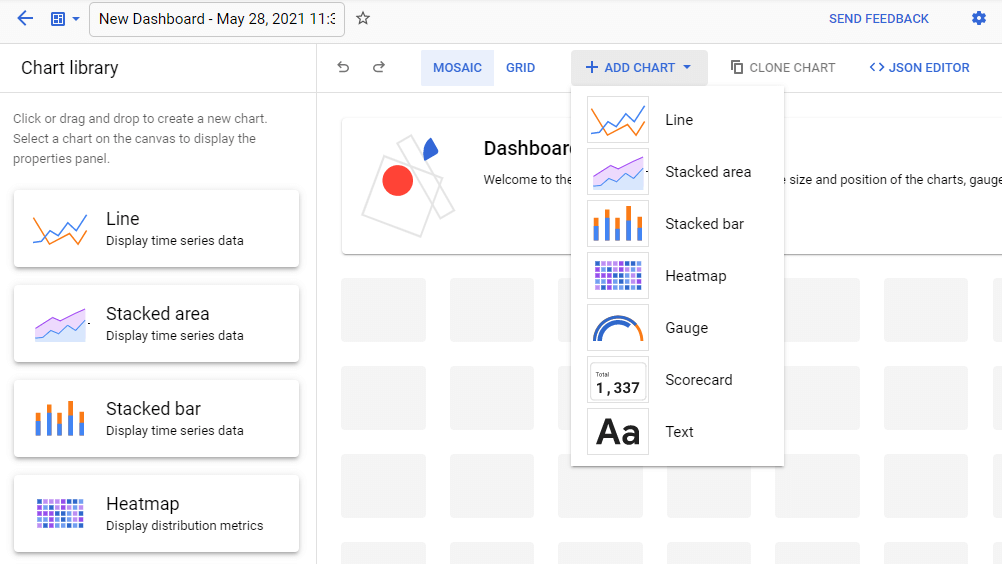
To add a chart, click Add Chart and select the data display method you want.
Select the data you want to display:

And you have a ready dashboard.
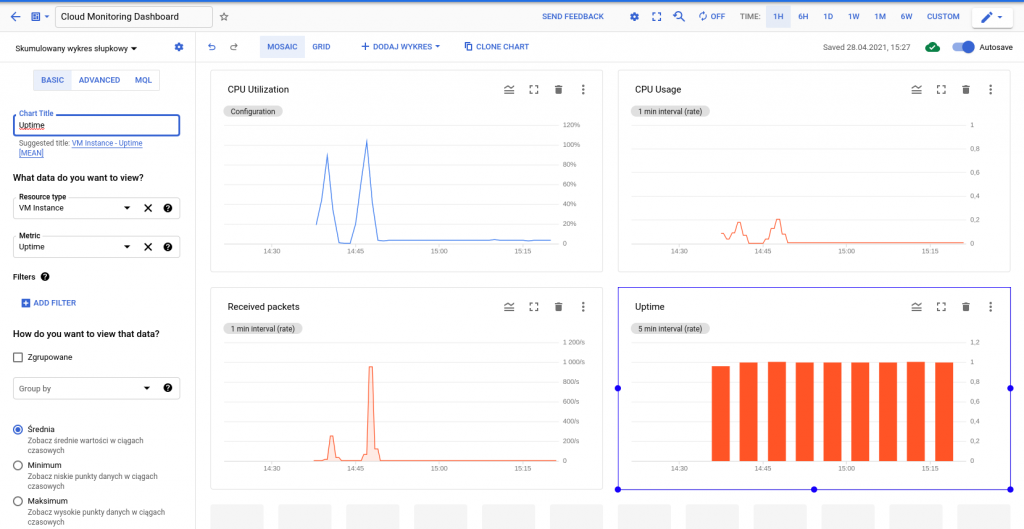
The charts will be visible in the Monitoring > Dashboards panel.
Ask an expert
If you want to be sure that you are taking full advantage of Cloud Monitoring, Contact us. We will connect you with certified Google Cloud Architects who will help you go through the entire process step by step and answer your questions.